This report provides insights into the distribution of active and inactive users across all clients. It helps you identify usage patterns, understand client engagement levels.
You can analyze the report using the following metrics:
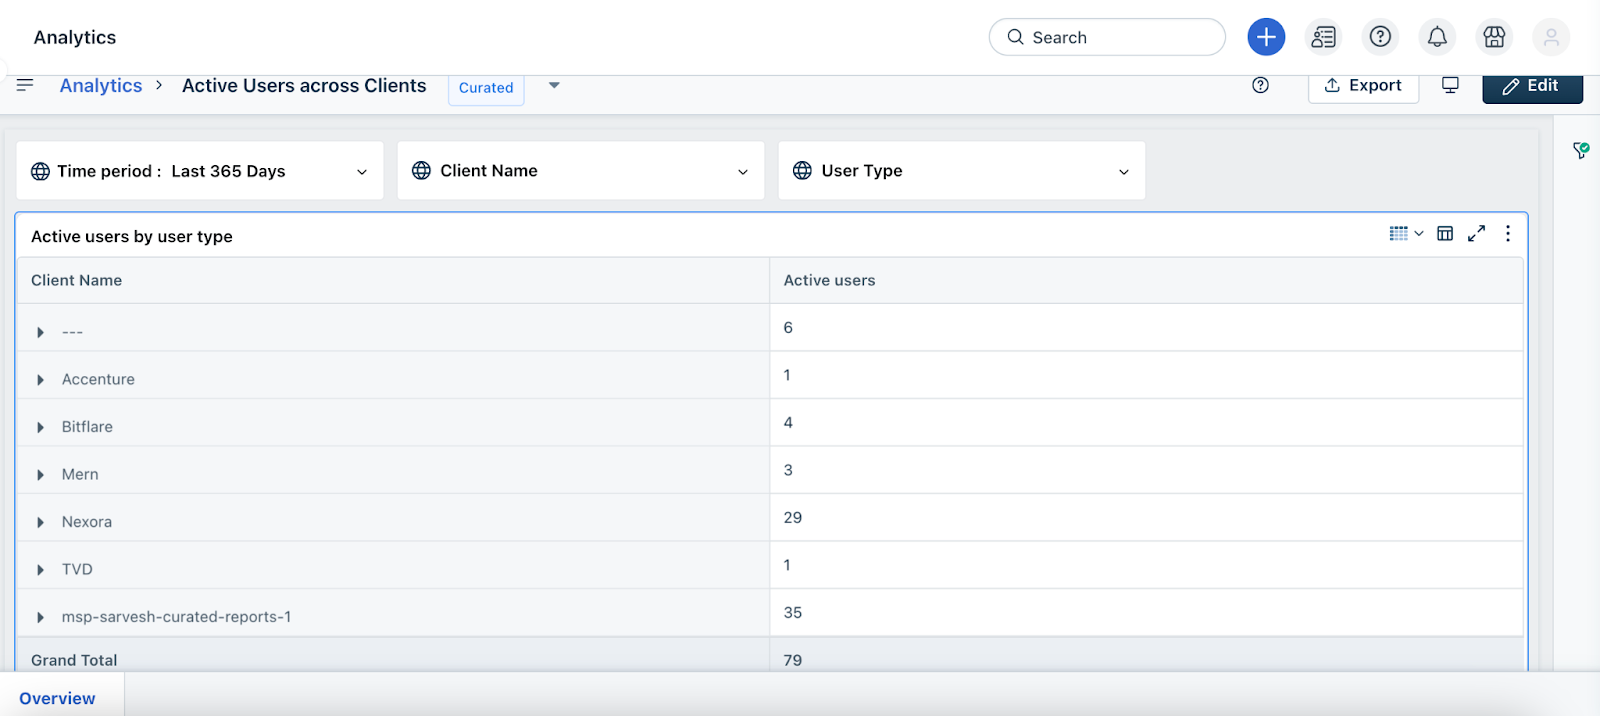
Work with global filters
Curated reports come with predefined filters across all tabs that help you narrow down data to suit your analysis needs. Below is a list of available filter types, their descriptions, and the possible values you can use.
Filter Type | Description | Available Values |
Time Period | Defines the date range for the data displayed in the report. | Set a custom date or select a predefined range: last 7 days, 30 days, month, quarter, or year. |
Client Name | Filters data by specific clients in your account. | List of all active client names. |
User Type | Filters based on the type of user. | Agent, Contact, Occasional Agent, Requester |
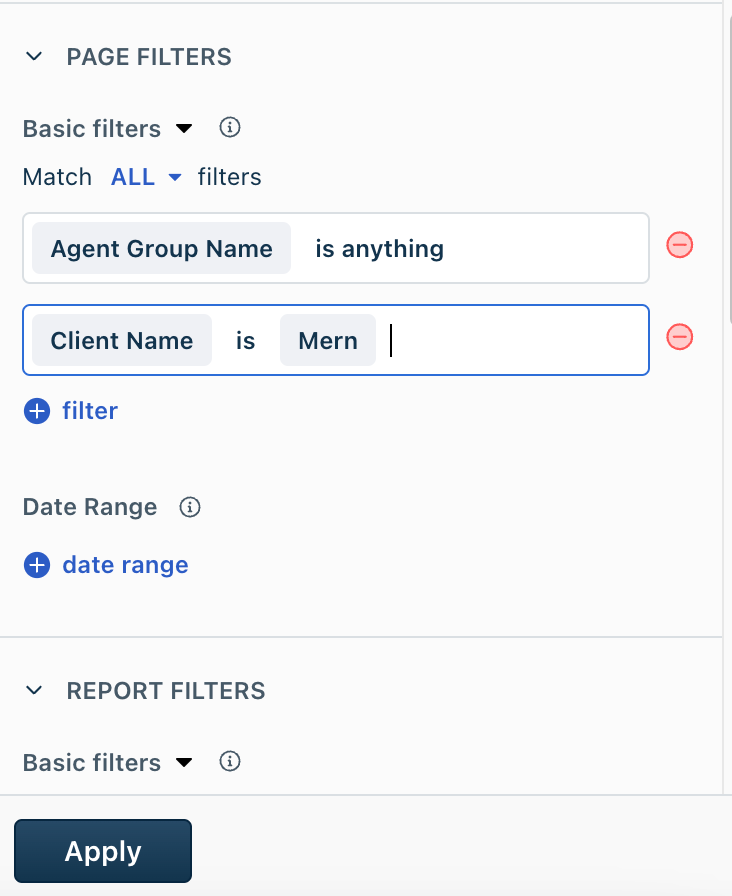
Apply filter
Click Edit and apply the following filters on the report based on your requirement:
Page filters
Report filters
Date range
Edit a widget
To edit a widget, hover over a widget in any of the tabs and you can perform the following actions.
Action | Description |
Change visualization | Change is the display to map, chart or table based on your requirement |
Underlying data | Opens the widget data in a dialog box. Use the Filter button to filter the data based on the available metrics. Use the Export button to export the data in CSV, XLSX format, and so on.
|
Expand | Expands the widget view. |
More options | Shows more options, such as filters applied, schedule, subscribe, and so on. |